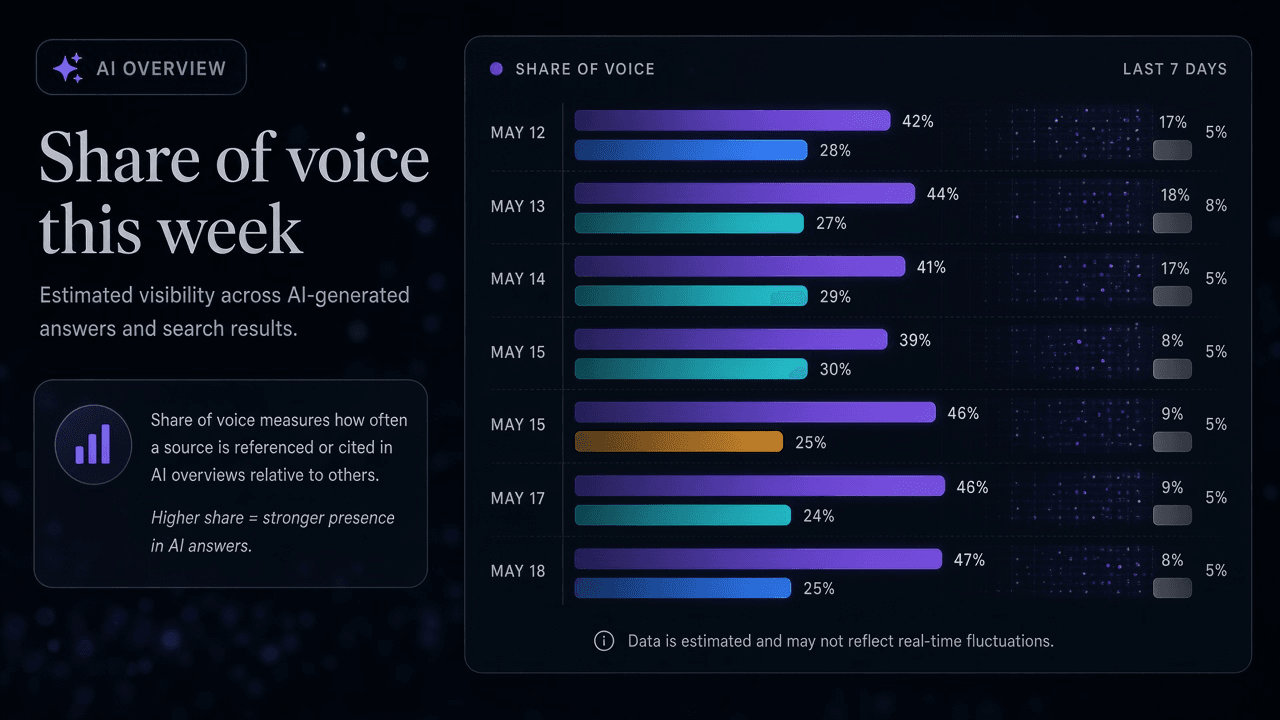
AI Overview Share of Voice: A Benchmark Small Teams Can Track Weekly

Table of Contents
A small team tracks AI Overview share of voice every week by freezing a buyer-query panel, counting your citations against two named competitors inside Google AI Overviews, and logging one fraction. The pass fits in 30 to 60 minutes. That single number is the benchmark. Everything else is a different sport.
I am William Spurlock, founder, AI Systems Architect, and Fractional AI CTO. I have been SEO-certified since 2021; the work now sits under AEO, AIO, and GEO. I have shipped 600+ automations with 500+ live, logged 20,000+ hours inside agentic systems, and deleted 35,000+ hours of client busywork across that book of work. I do not invent brand names, fake citation lifts, or 2026 click-through rates nobody published.
This spoke owns one operating question: How can a small team track AI Overview share of voice every week? June 27
how to measure AI visibility
owns the metric taxonomy. August 20
how to track when AI tools cite or recommend your business
owns the multi-engine cite-versus-recommend tracker plus Search Console and GA4. This page is the Monday scorecard for Google AI Overviews only.
If you do not yet know whether AI even names you, run the
15-minute AI visibility audit
once, then come back and freeze the weekly panel.
What is weekly AI Overview share of voice? #
Weekly AI Overview share of voice is your citation count inside Google AI Overviews on a frozen query panel, divided by your citations plus Competitor A plus Competitor B, for the queries that showed an Overview that week. One fraction. Same panel next Monday. That is the whole definition.
Google describes AI Overviews as an AI-generated snapshot at the top of Search that can include links to supporting pages. The snapshot is the unit you score. A blue-link rank under the snapshot is not a citation. A brand name in a forum thread Google happened to rank is not a citation. A ChatGPT answer is not this number.
I keep three labels separate so the fraction stays honest:
| Label | What you count | What you do not count |
|---|---|---|
| Citation | Your brand name or a URL of yours appears as a source inside the Overview | A ranking under the Overview with no source chip |
| Competitor citation | Competitor A or Competitor B appears the same way | A third brand you did not pre-commit to track |
| No Overview | Log the query as "AIO off this week" | Do not force it into the fraction |
The June zero-click FAQ on this site already defines share of voice in the abstract. I am not rewriting that sentence. The weekly version adds three constraints a three-person team can actually keep:
- One engine. Google Search with an AI Overview visible. Not ChatGPT. Not Perplexity. Those belong on the August 20 tracker if you later want a second ledger.
- One competitor set. You plus two names you pre-write. If a fourth brand shows up, note it in a comment cell. Do not expand the denominator mid-month.
- One cadence. Weekly. Daily checking is noise. Monthly is how you miss a flip that lasted three weeks.
Share of voice is not "how often an Overview appears." Trigger rate is a side log. The score is who Google credits inside the Overview when it appears.
Share of voice is not Share of Model. Share of Model, as I use it on the measurement pillar, asks whether a model recommends you across engines. This post does not own that.
If you want six Looker panels, stop. That is a dashboard project. A small team needs a fraction they can recompute before standup.
Why does a small team need this number every week? #
Clicks on informational queries keep shrinking when an AI Overview is present, so a weekly citation fraction is the earliest honest signal a small team can afford. Rank trackers still report position. Position is not the conversation Google is having at the top of the page.
The public studies I will cite are dated. I am not inventing a 2026 CTR for your niche.
Ahrefs, April 17, 2025 studied 300,000 keywords and found AI Overview presence correlated with a 34.5% lower average click-through rate for the top-ranking page versus similar informational keywords without an Overview (March 2024 versus March 2025).
Ahrefs, February 4, 2026 re-ran the method on December 2025 data. The same comparison now reads 58% lower average CTR for position one when an Overview is present (December 2023 versus December 2025).
Seer Interactive's September 2025 CTR update (published November 4, 2025; 3,119 informational and educational queries, June 2024 through September 2025) measured organic CTR on Overview-present queries falling from 1.76% to 0.61% — a 61% decline. On queries where a brand was cited inside the Overview, they measured 35% more organic clicks and 91% more paid clicks than when that brand was not cited. Seer says they cannot prove citation causes the lift. Stronger brands may simply get cited more. Treat the gap as a reason to count citations, not as a promised traffic bump.
SparkToro, June 9, 2026 (Similarweb US panel, January through April 2026) found 68.01% of Google searches ended without a click to the open web, up from 60.45% in 2024. SparkToro points at AI Overviews on 20%+ of searches and at Ahrefs' finding that Overviews cut click-through by nearly 60% when they appear.
That is the stake. If more than two-thirds of searches never leave Google, and Overviews are one of the reasons, then "we still rank #2" is a vanity slide. The weekly question is: when Google writes the answer, whose pages does it credit?
A weekly cadence earns its hour for four reasons a monthly dashboard does not:
- Flips expire. An Overview can swap sources between Mondays. If you sample once a quarter, you will argue about a ghost.
- Shipping has a clock. A FAQ you published Tuesday should show up in the fraction within a few weeks or it did not work. Weekly is how you notice.
- Small teams cannot staff six engines. ChatGPT and Perplexity matter. They are not this scorecard. Mixing them into one blended "AI SOV" is how you hide a Google loss behind a chat win.
- Leadership funds a number they can repeat. "We held 4 of 16 branded citations this week" is a sentence. "Our visibility index is 62" is a vendor.
I would rather a three-person company run this fraction every Monday than buy a prompt-tracking seat they will not open.
How can a small team track AI Overview share of voice every week? #
Freeze 12 to 20 buyer questions, run them in Google Search on the same weekday, score only source-level citations inside the AI Overview, and compute your citations divided by (you + Competitor A + Competitor B). Budget 30 to 60 minutes. Stop when the hour is gone. If the panel does not fit the hour, the panel is too big.
This is the method. It is not a multi-engine audit. It is not a Search Console reading. It is not a GA4 channel group. Those layers live on the August 20 tracker. Do not drag them into this fraction.
Step 1 — Freeze the query panel (once, then protect it) #
Write 12 to 20 questions a buyer would type before they call you. Real questions, not your homepage headline.
Rules that keep the panel honest:
- Buyer language. "best [category] for [job]" and "who should I hire for [outcome]" beat your brand slogan.
- Overview-prone. Informational and commercial-investigation queries. Ahrefs noted that 99.2% of keywords that triggered Overviews in their April 2025 sample were informational. Skip pure navigational brand queries. Those do not teach you share of voice.
- Your market, your language. If you sell in the United States in English, run the panel that way every week. Do not mix a VPN country into week four.
- No weekly edits. You may add a query at the start of a month. You may not swap five queries because last week felt ugly.
Cap the list at 20. Twenty queries at two minutes each is forty minutes. Ten minutes left for the tally. That is the 30-to-60-minute box.
If you cannot name 12 buyer questions, you do not have a measurement problem. You have a positioning problem. Fix the offer language first.
Step 2 — Pre-commit the competitor set #
Write you, Competitor A, and Competitor B before the first run. Pick the two names Google already puts next to you in sales conversations, not the two brands you wish you competed with.
| Seat | Who belongs there | Who does not |
|---|---|---|
| You | Legal name plus the trading name buyers use | A product SKU nobody searches |
| Competitor A | The firm that shows up on the same shortlists | A global publisher that is not in your deal cycle |
| Competitor B | The second name sales actually hears | A directory, a Reddit user, or "the internet" |
If a fourth brand appears inside an Overview, log it in a notes column. Do not rebuild the fraction around them until the next month's panel review.
Step 3 — Run Google, not a chat engine #
Open a logged-out or clean profile. Same weekday. Same hour band if you can. Search each panel query on google.com (or your market host).
For each query, record:
- Date
- Query (verbatim)
- AI Overview present: yes / no
- You cited: 1 / 0
- Competitor A cited: 1 / 0
- Competitor B cited: 1 / 0
- Your cited URL, if shown
- Notes (wrong entity, outdated claim, fourth brand)
A citation is a source chip, a named link, or a clear brand attribution inside the Overview body. A classic result underneath the Overview is a rank, not a citation. If Google shows an Overview with no sources, score everyone 0 and mark "unsourced Overview."
Do not run the same query in ChatGPT "for comparison" and average the two. That is how this number stops meaning Google.
Personalization is real. You will not get a laboratory SERP. You will get a repeatable-enough SERP if you stop changing devices, accounts, and countries. Write the environment in the sheet header: browser, logged-out, market, language. Repeat it.
Step 4 — Compute one fraction #
Only rows where an AI Overview appeared and at least one of the three brands was cited enter the math.
Weekly AIO SOV = You_citations ÷ (You_citations + Competitor_A_citations + Competitor_B_citations)That is a simple fraction. Write it as both a ratio and a percent so a human can read it in Slack: 4 / 16 and 25%.
| Row type | In the fraction? | Why |
|---|---|---|
| Overview on, you cited, A cited, B not | Yes | Three-brand math |
| Overview on, nobody in the trio cited | No | Open query; log separately |
| Overview off | No | Trigger miss; not share of voice |
| Overview on, only a fourth brand cited | No | Outside the committed set; note it |
Two side counts stay off the scorecard:
- Trigger rate = Overviews shown ÷ panel size. Useful. Not the KPI.
- Your inclusion rate = queries where you were cited ÷ Overviews shown. That is a vanity cousin. It ignores competitors. Do not let it replace the fraction.
Step 5 — Spend the last ten minutes on one decision #
After you write the fraction, pick one next action:
- A query where Competitor A took the source chip and your page is thin
- A query where you were named with the wrong service
- A query that stopped triggering an Overview (side log, not the score)
Then stop. The weekly pass is a measurement habit, not a content sprint. Shipping the fix happens after the hour, not inside it.
A three-person team can rotate the owner. Same sheet. Same rules. If two people score the same Monday and disagree on a citation, the rule is: source chip or named URL wins; vibes lose.
What does a worked weekly scorecard look like? #
Here is a labeled hypothetical for a 16-query panel. Invented agency names and invented lift percentages stay out. The only brands in the math are you, Competitor A, and Competitor B.
This is a counting illustration, not a case study. I am not claiming these rows came from a client, and I am not claiming a content change produced a percentage gain.
Hypothetical Monday log — week of 2026-09-01. Market: US English. Logged-out. Panel frozen.
| Query (short label) | AIO? | You | Comp A | Comp B | In fraction? |
|---|---|---|---|---|---|
| Q1 best [category] for [job] | Yes | 1 | 1 | 0 | Yes |
| Q2 who to hire for [outcome] | Yes | 0 | 1 | 1 | Yes |
| Q3 [category] vs [adjacent category] | Yes | 1 | 0 | 0 | Yes |
| Q4 how to choose a [provider] | Yes | 0 | 1 | 0 | Yes |
| Q5 [job] checklist for [buyer] | Yes | 1 | 1 | 1 | Yes |
| Q6 cost of [service] in [region] | Yes | 0 | 0 | 1 | Yes |
| Q7 [service] for [industry] | Yes | 1 | 0 | 1 | Yes |
| Q8 common mistakes in [job] | Yes | 0 | 1 | 0 | Yes |
| Q9 [tool] alternative for [job] | Yes | 0 | 0 | 0 | No — open |
| Q10 near me [service] | No | — | — | — | No — no AIO |
| Q11 [compliance] requirements | Yes | 0 | 1 | 1 | Yes |
| Q12 [service] SLA what to ask | Yes | 0 | 0 | 0 | No — open |
| Q13 [category] for first-time buyers | Yes | 0 | 1 | 0 | Yes |
| Q14 how long does [job] take | Yes | 0 | 0 | 1 | Yes |
| Q15 [service] red flags | Yes | 0 | 1 | 0 | Yes |
| Q16 [category] questions to ask | Yes | 0 | 0 | 0 | No — unsourced |
Tally for rows in the fraction (Q1–Q8, Q11, Q13–Q15): 12 rows.
| Brand | Citations in those 12 Overviews |
|---|---|
| You | 4 |
| Competitor A | 8 |
| Competitor B | 5 |
| Total | 17 |
Weekly AI Overview share of voice = 4 ÷ 17 = 23.5%. Write it on the scorecard as 4/17.
Side logs, not the KPI:
- Trigger rate: 15 / 16
- Open / unsourced Overviews: 3
- Your inclusion among Overviews shown: 4 / 15
That is what "one number" looks like in a real sheet. The 23.5% is a snapshot of this invented week, not a target I am selling you.
A four-week stub — still hypothetical, still no campaign story attached — looks like this:
| Week of | You | A | B | Total | SOV |
|---|---|---|---|---|---|
| 2026-09-01 | 4 | 8 | 5 | 17 | 4/17 |
| 2026-09-08 | 5 | 7 | 5 | 17 | 5/17 |
| 2026-09-15 | 3 | 9 | 4 | 16 | 3/16 |
| 2026-09-22 | 5 | 8 | 6 | 19 | 5/19 |
Read the ratio, not a made-up "we grew 12% after schema." Week-to-week movement of one or two citations is normal. A four-week slide in the same direction is a meeting.
Keep the raw rows. A screenshot of one Overview per flipped query is enough evidence for a founder. You do not need a BI tool to prove 4/17.
What should you do when the weekly number moves? #
Treat a two-week move of more than a few citations as a content and entity problem, not a tracking-software problem. The fraction tells you that Google reassigned credit. Your site and your entity graph tell you why.
Decision table I use when a small team texts me the Monday number:
| Pattern | What it usually means | First move this week |
|---|---|---|
| You drop, A rises, same queries | A published a clearer answer Google can lift | Rewrite the losing URL as a direct answer, not a brand essay |
| You hold citations, trigger rate falls | Google stopped synthesizing those queries | Do not panic-edit. Watch two more weeks. Check the side log. |
| You appear with the wrong service | Entity collision | Align the page title, the H1, and the Organization name |
| Open Overviews pile up | Google answers without naming anyone in your set | That query may not be a brand fight yet. Keep it logged. |
| Fourth brand keeps appearing | Your competitor set is stale | Review at month end, not mid-week |
What I do not do with this number:
- I do not average it with ChatGPT or Perplexity "to get a fuller picture." That fuller picture is a second ledger.
- I do not "correct" a down week by adding friendlier queries.
- I do not convert
4/17into a revenue forecast. Seer's citation-versus-uncited gap is a published correlation with an explicit causality caveat. It is not your close rate. - I do not wait for Search Console to grow a perfect AI Overview click column. As of September 2026, you still cannot cleanly split Overview clicks from the rest of organic in the standard reports I use. That fight belongs on the August 20 post.
When the fraction is stuck and the pages are vague, the fix is a site that AI Overviews can quote: question headings, first-sentence answers, FAQ blocks, and entity-consistent service pages. That is AIO and AEO work on the public URL, not a new analytics property.
If you want the broader metric set after this habit is boring, go back to the
2026 measurement pillar.
If you want cite versus recommend across engines, plus GSC and GA4, use the
multi-engine tracker.
This page stays the weekly Google fraction.
Frequently Asked Questions #
How do I track when my website is cited in an AI Overview? #
Open the frozen panel in Google Search, and count a citation only when your brand or URL appears as a source inside the AI Overview. A ranking under the snapshot does not count. Repeat the same queries each week so a missing chip is a flip, not a new sample. Screenshot the Overview on flips. That is the entire tracking loop for this benchmark.
How many queries belong on a weekly AI Overview share of voice panel? #
Twelve to twenty buyer questions is the range that still fits a 30-to-60-minute Monday. Fewer than twelve and one noisy Overview swings the fraction. More than twenty and a small team will skip weeks. Freeze the list. Add at month boundaries, not when last Monday looked bad.
Does getting cited in an AI Overview bring traffic to my website? #
Sometimes, and the public studies do not promise your site a lift. Ahrefs measured lower average CTR on Overview-present queries (34.5% in April 2025, 58% in the December 2025 rerun). Seer found cited brands earned more clicks than uncited brands on the same class of queries, and they refuse to call that proof of cause. Count citations because Google is assigning credit. Do not book revenue on a citation.
Should ChatGPT or Perplexity sit inside this weekly share of voice number? #
No. This number is Google AI Overviews only. ChatGPT and Perplexity are useful contrast ledgers. Mixing them into one blended SOV hides a Google loss behind a chat mention. If you want mention versus citation versus recommendation across engines, that is the August 20 method, not this fraction.
How do I pick Competitor A and Competitor B for the fraction? #
Pick the two names buyers already put next to you, then refuse to expand the set mid-month. Sales call notes beat a global "category leaders" slide. If a fourth brand keeps taking the source chip, write them in the notes column and review the set on the first Monday of the next month.
What if an AI Overview cites no brands that week? #
Leave that row out of the fraction and log it as an open or unsourced Overview. A 0/0 cell is not 0% share of voice. Forcing it into the denominator punishes you for queries Google has not turned into a brand fight. Watch the open-query count as a side log. Do not let it overwrite 4/17.
How long does a weekly AI Overview share of voice pass take? #
Thirty to sixty minutes if the panel stays at 12 to 20 queries and you score only the Overview. Two minutes per query, ten minutes to tally, five minutes to pick one follow-up. If the pass blows past an hour, you are reading classic results, opening chat engines, or rewriting copy during measurement. Cut scope. Measure first.
How is weekly AI Overview share of voice different from AI Overview inclusion? #
Inclusion asks "did we appear." Share of voice asks "what share of the credited citations did we take versus two committed competitors." You can be included on four Overviews and still lose the week if Competitor A took eight. Inclusion is a side count. The benchmark is the fraction.
Get a Premium AIO/AEO website that can move the Monday number #
A weekly fraction does not invent citations. Google needs pages it can lift: question-led headings, first-sentence answers, FAQ blocks, and entity-clear service URLs. If the site is a slogan with a contact form, 0/17 will keep reprinting itself.
I build Premium AIO/AEO websites for operators who want that extractable layer designed in, then keep a 12-to-20 query scorecard after launch. The offer is the site, not a six-engine dashboard and not a cite-versus-recommend audit of every chat product.
If you want an AI-visibility-ready site built so the weekly AI Overview share of voice number has something to count, use /contact. Bring the frozen panel if you already have one. If you do not, we write it on the call.
SEO-certified since 2021. Founder, AI Systems Architect, Fractional AI CTO. The job this Monday is one Google fraction — your citations over you plus Competitor A plus Competitor B — inside the Overviews that actually appeared.
Related Posts

Does having a physical address listed consistently across the web help AI visibility?
Does having a physical address listed consistently across the web help AI visibility? Only when the page, the markup, and the profile name the same real door.

How do I know if AI is recommending my competitors instead of me?
How do I know if AI is recommending my competitors instead of me? Copy the hire sentence. Their name in it, and yours missing, is the instead line today.
What is conversational search optimization and how does it fit with AEO?
What is conversational search optimization and how does it fit with AEO? I use one second-turn card on one URL so a short follow-up still names the business.